Italy is the fifth most visited country on earth and one of Europe’s two dominant long-haul leisure destinations. Tourism is a structural pillar of the Italian economy, generating roughly 6% of GDP directly and supporting employment in accommodation, food service, transport, arts, and retail. The figures below draw on ISTAT (Italy’s national statistics institute), Banca d’Italia (Bank of Italy), and UNWTO World Tourism Barometer data, current to 2023–2024.
International arrivals
Italy recorded 57.3 million international tourist arrivals in 2023 — its first full post-pandemic year, and a figure that represents a near-complete recovery from the 64.5 million recorded in 2019 before COVID. The shortfall from 2019 is largely explained by the continued partial recovery of Chinese outbound travel, which was Italy’s fastest-growing source market in 2016–2019.
By comparison, France consistently leads Europe with approximately 100 million arrivals, while Spain typically records 75–85 million. Italy’s figure is broadly comparable to the United States and Turkey on the global ranking.
Domestic tourism adds substantially to these totals. Italian residents make approximately 180–190 million domestic overnight trips annually, providing a significant floor of demand during shoulder and low seasons when international arrivals fall.
Visitor spending and economic impact
International visitor receipts: approximately €44 billion (2023), according to Banca d’Italia balance of payments data. This places Italy among Europe’s top three tourism earners alongside France and Spain.
Average spend per international trip: approximately €740–780, with considerable variation by market:
- US visitors average €1,200–1,500 per trip — the highest of any major source market — driven by longer stays and higher daily budgets
- UK visitors average €800–900, with a mix of city breaks and longer holidays
- German visitors average €550–650, reflecting Italy’s role as a popular and accessible European short-break destination
- French visitors average €350–450, reflecting high day-tripper share and shorter stays in border regions
Accommodation and food service together represent approximately 55–60% of total tourist expenditure. Cultural attractions and shopping represent a further 20–25%.
Top cities and regions by overnight stays
Rome dominates Italian tourism by volume, attracting approximately 15–16 million international overnight stays per year. The Vatican, Colosseum, and Forum are consistently among Europe’s highest-grossing paid attractions.
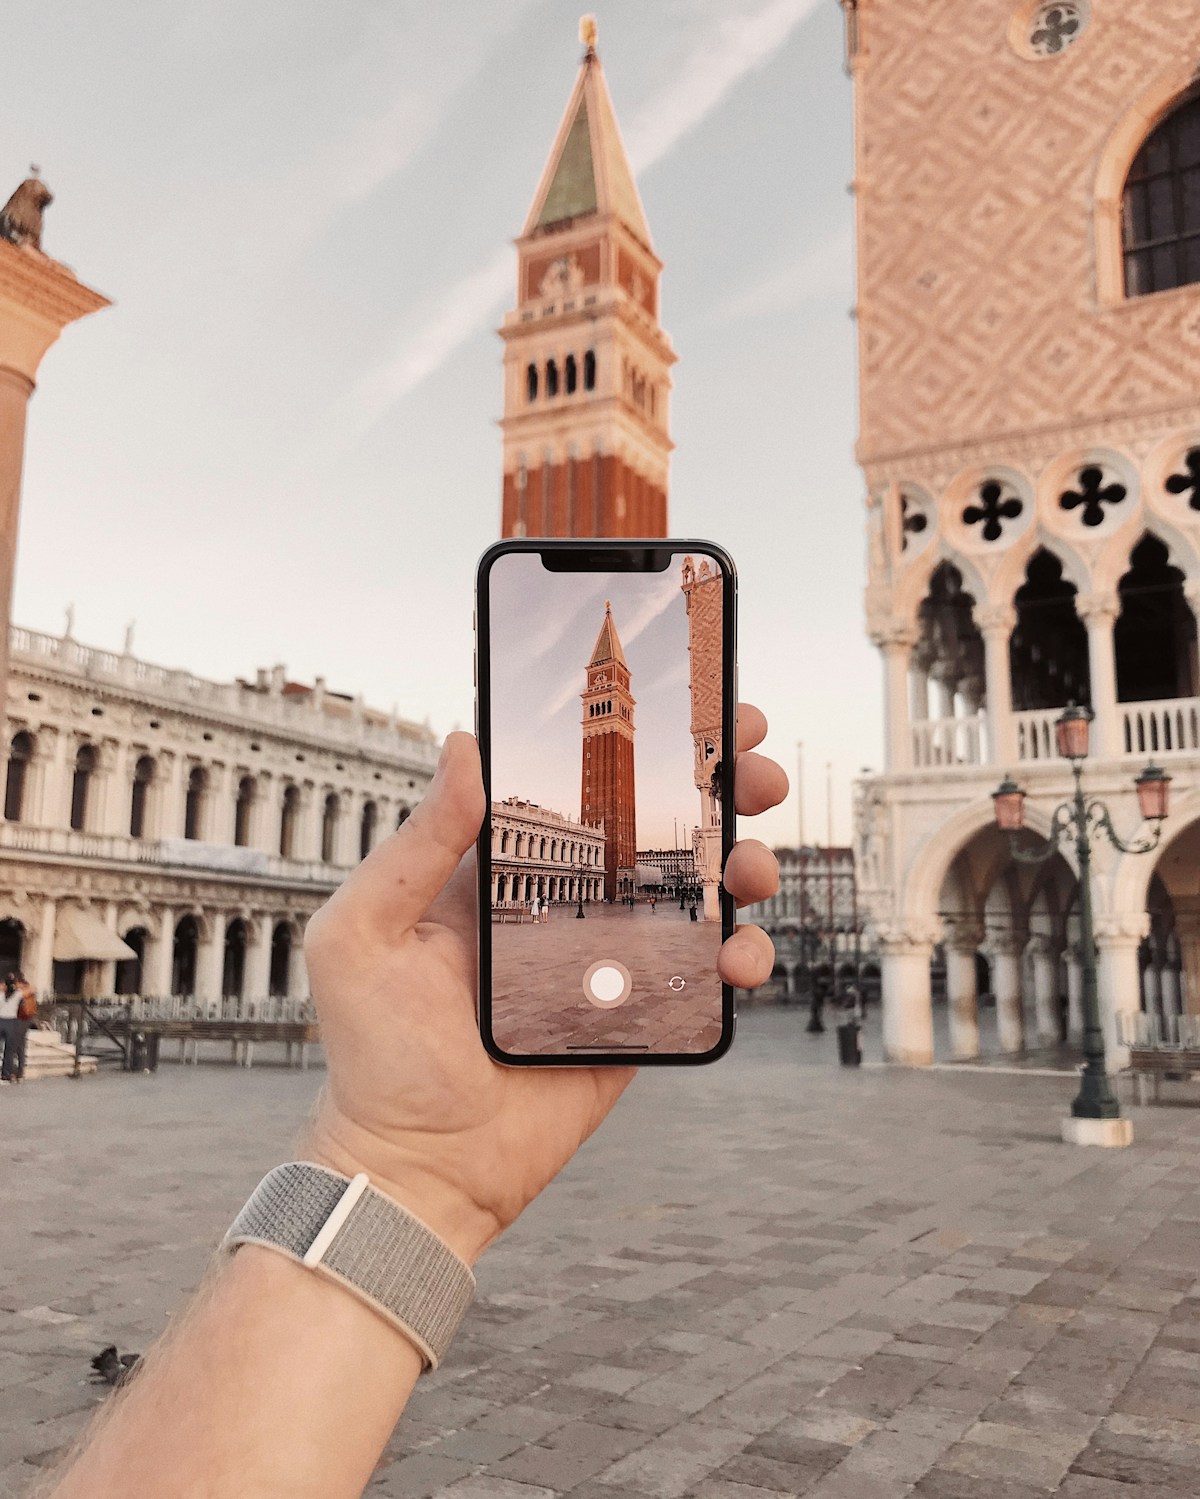
Venice is the most intense tourism destination relative to its size — a resident population of roughly 250,000 (city area) hosts 5–6 million international overnight stays and an estimated 10–15 million additional day-visitors annually. The city introduced a day-tripper access fee in 2024 (€5 on peak dates), the first of its kind in Italy.
Florence attracts approximately 4.5–5 million international overnight stays, with the Uffizi, Accademia (David), and Duomo complex among its primary draws.
Milan attracts approximately 4–5 million international overnight stays, distinguishing itself from other major Italian cities through a high proportion of business and MICE (meetings, incentives, conferences, exhibitions) travellers alongside leisure visitors.
Naples and the Amalfi Coast, Puglia, Sicily, and Sardinia have grown significantly as destinations since 2015, with Naples in particular drawing strong interest following increased international media coverage. Regional dispersal remains a policy priority for the Italian government.
Source markets
Germany is Italy’s largest inbound market by arrivals, accounting for approximately 12–14% of international overnight stays. The combination of proximity, direct road and rail access, and decades of established demand makes Germany a reliable baseline.
France ranks second by volume, though average spend is lower given the high share of short stays and cross-border travel.
United States is the third or fourth largest market by arrivals but generates the highest absolute spend of any non-European market. US arrivals to Italy exceeded 5 million in 2023, recovering well past 2019 levels.
United Kingdom remains a major market despite post-Brexit travel friction, typically ranking fourth or fifth by overnight stays.
Other significant markets: Switzerland, Netherlands, Austria (all high by proximity), Japan, South Korea, Australia (high by spend-per-visit).
Seasonality
Italian tourism is heavily concentrated in summer. July and August together account for approximately 30–35% of annual international overnight stays, creating significant pressure on accommodation, transport, and cultural sites in peak months. Venice, the Amalfi Coast, and Cinque Terre experience the most acute congestion.
April–June and September–October represent the strongest shoulder season, with pleasant weather, manageable crowds, and better value across most regions. November–March is low season for most of the country, with the notable exception of ski resorts (Dolomites, Valle d’Aosta) and Christmas markets (December).
Tourism density and overtourism
The concentration of visitors in a small number of cities and sites has made overtourism one of Italy’s most discussed policy challenges. Venice, Cinque Terre, and parts of Rome and Florence receive volumes of visitors that stress infrastructure, drive up local housing costs, and degrade the visitor experience.
Policy responses have included Venice’s day-tripper fee, cruise ship bans in the Grand Canal, Cinque Terre visitor limits on peak hiking days, and ongoing debate about reservation systems for major Roman sites. These measures are evolving — check current requirements before visiting peak-demand sites.
Italy’s broader strategy is to encourage regional dispersal — promoting Puglia, Matera, Basilicata, Calabria, and inland historic towns that have significant cultural assets but receive a fraction of the visitors concentrated in the north and in Rome.
Long-term trend
Italian international arrivals grew at approximately 3–4% annually in the decade before COVID. The 2020–2021 contraction was severe (arrivals fell approximately 70% in 2020), but the recovery from 2022 onwards was faster than most forecasters expected. UNWTO and Italy’s national tourism agency (ENIT) project continued growth toward 70+ million arrivals by 2030, subject to global economic conditions and the continued recovery of Asian long-haul demand.